Boston Parking Tickets
tl;dr feed your parking meters people.
Last year (mid December 2020) I created a Freedom of Information Act request for all parking tickets issued in Boston from 2011 to the end of 2020. Eventually I was given 40 CSV files that I've combined into a simple torrent you can download here:
boston-parking-tickets-2011-2020.tar.gz
Please feel free to send me an email if you don't wish to use BitTorrent, and I'll do my best to send you a copy using a different protocol.
These (very messy) files have data on every ticket, time and date it was issued, violation and fine total, how much was payed, the license plate number and state, including the car's make, style and color on every parking ticket. Also included is the hand-entered location of where the ticket was issued.
I say messy, because each ticket is manually entered on very small screens, often by parking attendants wearing gloves during winter while someone is telling them about their very bad day. Understandably there is a lot of typos and cleaning to do.
All of the code for these examples, along with the torrent file, is available in a git repository here. My goal is to implement various data cleaning techniques to see how well I can prepare this data for processing. What follows is the little bit of data expiration.
Tickets Issued in each Year

Boston police officers issued 13,023,114 parking tickets inside the Boston city limits between January 1st 2011 and December 31st 2020. If we exclude 2020 and its relaxed parking rules, Boston receives on average 1,367,606 (±51,848) parking tickets each year.
Surprisingly there wasn't a significant change in the number of tickets issued during each year even as Boston's population continues to grow.
I had assumed this would correlate with Boston's population growth, however a simple linear fit shows there are 3,358 fewer tickets being issued each year, well within the margin of error of the 1.4 million tickets issued on average.
Tickets Issued in each Month
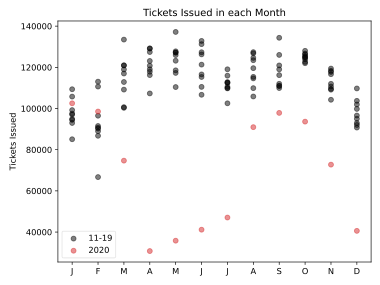
Another interesting thing I noticed (for this southerner) if we plot the number of tickets issued by month, we can clearly see a dip in tickets during the winter months.
I have no evidence to support this, however, I assume the snow covered streets of Boston during the winter reduces the available metered parking spaces, or removes the 20,000 people willing to park their car when snow plows are actively roaming.
On average there is a decline of 20,000 tickets during the winter months. If we exclude 2020 again (shown here as red dots), there is on average 117,000 tickets issued each month.
Tickets Issued by Day of Month
Drilling further into when tickets are issued, if we look at each day in a month each ticket is issued (excluding the 31st day of the 7 months that have 31 days) we can see a pretty steady ticketing rate. Again the red dots represent data from 2020 and are not included in the white shaded standard deviation range.

We can also clearly see the 572 days with under 1,000 tickets issued. As we'll see in the next section, this is mostly due (80% of the 572 day) to the relaxed parking rules on Sundays when most parking meters are turned off.
Tickets Issued by Day of Week

Like I was saying in the last section, parking on Sundays and City holidays is free. When we split the tickets issued by day of week we can see just how great this policy is for people who fail to feed their meters.
It's also interesting to see the reduction (roughly 1,000 on average) in tickets issued on Mondays. As of right now I don't have a good explanation as what could cause this.
Tickets by Violation

When we see what type of violations people are breaking on average each year, we can start to see why Sundays and City holidays have such a huge impact on the number of tickets issued each day.
First place with 25.7% or 3,348,515 of all tickets issued was from unpaid parking meters, most of which are disabled on Sundays.
Followed by an ever shrinking list of significantly less common violations.
The To-Do List
There is still a large amount of cleaning work I would like to do in the future. There is currently many misspelled states, vehicle makes and models, ticket locations or cross streets indicated with different symbols all of which makes classifying this data a fun and difficult task.
As of right now though, I'll publish this dataset with the promise to see what insights we can gleam from it in the future.